Labels
About Me
Tuesday, July 20, 2010
How To Config the Default Settings for VI editor
2. config your settings in this file
And you are good to go
Monday, July 19, 2010
Procedures and Functions
Multiple Plots on a Page
Plots can be ganged on the display or page in the horizontal and/or vertical directions using the system variable field
- The first element of the vector contains the number of empty sectors remaining on the page. The display is erased if this field is zero when a new plot is begun.
- The second element of the vector contains the number of plots per page in the horizontal direction.
- The third element contains the number of plots per page in the vertical direction.
- The fourth element contains the number of plots stacked in the Z dimension.
- The fifth element controls the order in which plots are drawn. Set the fifth element equal to zero to make plots from left to right (column major), and top to bottom. Set the fifth element equal to one to make plots from top to bottom, left to right (row major).
Omitting any of the five elements from the vector is the same as setting that element equal to zero.
For example, to set up IDL to stack two plots vertically on each page, use the following statement:
!P.MULTI = [0, 1, 2]
Note that the first element,
!P.MULTI = [0, 2, 2]
To reset to the default of one plot per page, set the value of
!P.MULTI = 0

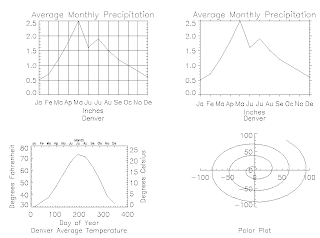
This figure shows four plots in a single window. For details, inspect the batch file plot09 in the examples/doc subdirectory of the IDL distribution. Note the following features of the plots in the figure:
- The plot in the upper left has grid-style tick marks. This is accomplished by setting the TICKLEN keyword equal to 1.0
- The plot in the upper right has outward-facing tick marks. This is accomplished by setting the TICKLEN keyword to a negative value.
- The plot in the lower left corner has different axes on left and right, top and bottom. This is accomplished by drawing the top and right axes separately, using the AXIS procedure.
- The plot in the lower right uses no default axes at all. The centered axes are drawn with calls to the AXIS procedure.
LSD journal
| Date | Content | Before | After | Comments |
|---|---|---|---|---|
| xx/xx/2008 | CREATED | |||
| 07/19/2010 | stast.pro | width mod (2*dw) | width mod fix(2*dw) | dw has to be integer or half integer |
| 07/20/2010 | stast.prowght.pro | if width mod fix(2*dw) ne 0 then begin width = width/fix(2*dw)+1)*fix(2*dw) endif | quot = fix(width/(2*dw)) width = quot*2.*dw | width and dw are better to be float type |
| 11/08/2010 | lsd.pro | combined all the pieces into one | ||
| 11/30/2010 | lsd.pro | contain no routine to exclude the lines in the gap of two orders | yes |
